abstract
Carbon in its graphite form has a hexagonal lattice structure. Electrons can pass through a thin layer (up to 10 atoms thick) because the structure is on the atomic scale. The wave-particle duality explains the wave-like behavior exhibited by electrons interacting with matter. Using the property of diffraction, the diameter of an aperture (in this case, the distance between carbons in graphite) can be determined. Because there are two different distances between carbon atoms in the lattice structure, there will be two diffraction maxima. After conducting the experiment in two different ways, we determined the distances in the lattice structure to be 1.27 +/- 0.04 Angstroms and 2.13 +/- 0.07 Angstroms
Introduction
Characterized by a pattern of maxima and minima, diffraction is the bending of light around an obstacle (Halliday, 2011). This phenomenon only occurs when the obstacle or aperture causing the diffraction is similar in size to the wavelength passing through (Pedrotti, 2007). This produces a problem when we are trying to use diffraction to measure the diameter of an aperture. If we do not know the size of the aperture, we do not know the wavelength that can be diffracted.
Light traveling through a constant medium has a set wavelength. In order to change the wavelength, the source of the wave must be altered to emit a different wavelength of light. In order to change the wavelength of a massive particle, like an electron, we change its velocity. So, it becomes more logical to use electrons to determine the size of an aperture because we can easily test large ranges of wavelengths by changing the potential difference accelerating the particles.
Electron diffraction was first used as a test of Louis de Broglie’s hypothesis that massive particles should exhibit wave-like behavior (Halliday, 2011). In 1937, George Paget Thomson won a Nobel Prize for observing the interference pattern of electrons passing through foil, and therefore demonstrating their wave-like properties. Ironically, his father, J.J. Thomson, had won the Nobel Prize 31 years prior for discovering the electron as a massive particle (Krane, 1996).
Theory
|
The condition for diffraction can be described as
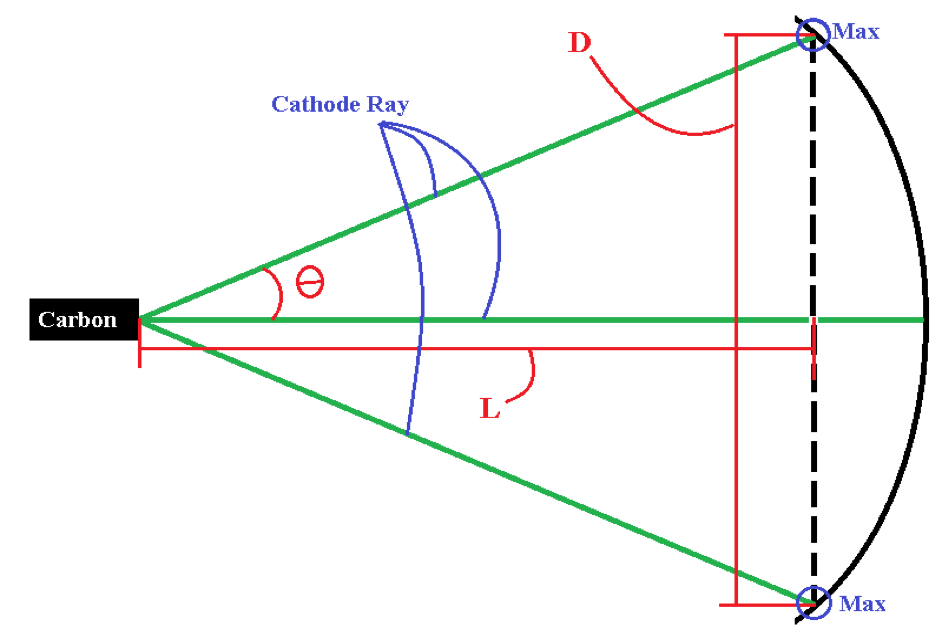
λ = d sin θ (1) where λ is the wavelength of the particle, d is the length of the aperture the light is bending around, and θ is the angle between the diffracted maximum and the unobstructed ray (Krane, 1996). For this experiment the electron beam will be passing through spaces in the lattice structure of graphite.Because the angle is smaller than , we can make the assumption sin θ = θ (2) Which allows equation (1) to reduce toλ = dθ (3) Again, using the small angle approximation for , we findθ = D⁄2L (4) where D is the diameter of the diffraction maximum, and L is the length from the source of the diffraction to the screen where the pattern is located as shown in Figure 1.Thanks to the work of Louis de Broglie, we have a means to calculate the wavelength of a massive particle. The de Broglie wavelength is defined as λ = h⁄mv (5) where h is Planck’s constant, m is the mass of the particle and v is the velocity of the particle. |
Assuming the mass of a particle is known, the velocity is the only remaining variable needed to find the wavelength. Accelerating an electron initially at rest in an electric field with a known potential difference, the kinetic energy can be found as
Equating equations (3) and (5), and substituting equations (4) and (7) for θ and mv, we rearrange to find
eVa=1⁄2 mv2 (6) where e is the charge of an electron and Va is the potential difference causing the electron’s acceleration. Solving for the momentum, we can rearrange equation (6) to bemv = √2meVa (7) D = 2Lh⁄d√2me 1⁄√Va (8) Plotting the inverse of √Va versus the diameter D, we find the graph has a slopems = 2Lh⁄d√2me (9) We can isolate d in terms of reported constants and observables sod = 2Lh⁄ms√2me (10) With equation (10), we can determine the spacing between the carbon atoms causing the diffraction of electrons. |
Experiment
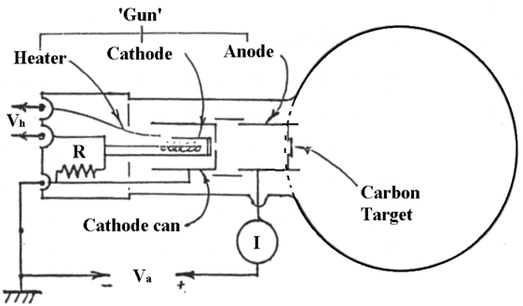
This experiment was conducted by passing an electron beam through a thin sample of graphite. The electron diffraction tube is an evacuated chamber containing an electron ‘gun’ that produces a beam of electrons. The tube heats a cathode can, which sweats the electrons off of the surface. The free electrons are accelerated from rest across a potential difference, Va. A schematic of the electron diffraction tube can be seen in Figure 2.
|
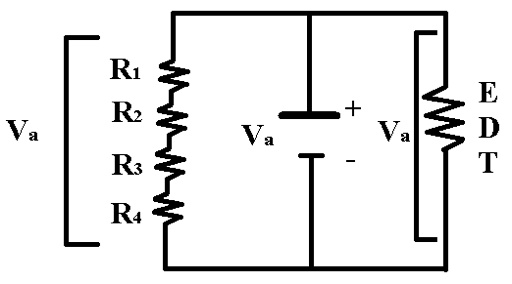
The electron diffraction tube is connected to a power supply with the ability of producing up to five kV of potential difference for the acceleration of the electrons. This potential difference, Va, is out of the range of the instruments we have at our disposal. We connected a series of four 10 kΩ resistors in parallel (as shown in Figure 3) so we could calculate the potential difference across the electron diffraction tube. Using an ammeter to measure the current, IR, through the equivalent resistance, R1234, we found the potential difference
Va = IRR1234 (11) |
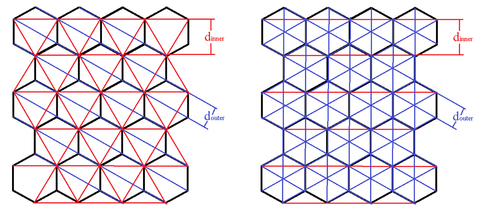 Figure 4: This is an exaggeration of the hexagonal crystalline structure of carbon in the graphite form. The red lines represent one diffraction grating and the blue represent the other. There are many orientations that yield the two distances in an organized pattern. The left shows the multiple orientations for diffraction leading to the inner ring. The right shows the patterns leading to the outer ring.
We then had a method to calculate the potential difference at any given time during the experiment. In addition, the power supply had a variable input for the voltage so we could set it to different values.
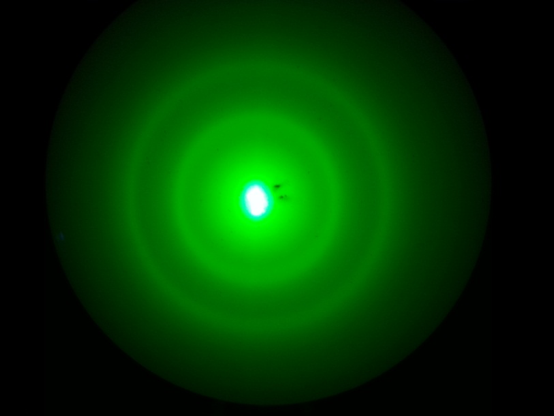
With a method to determine the voltage mentioned in equation (8), we used calipers to measure the diameter of the diffraction pattern, D. Noticing two distinct maxima, we measured the diameter of the larger and smaller values for each voltage. We found in our analysis each maximum represented a different distance, d, between carbon atoms. A further explanation for this phenomenon can be found in Figure 4.
To find the slope in equation , we set the potential to the lowest value which still produced distinct diffraction maxima for the inner and outer rings. Increasing the potential difference by intervals of approximately 250 V, we recorded the current through the resistors, and the diameters of both rings. We stopped increasing the potential difference as we approached 5000 V to prevent puncturing the carbon target from a current overload.
Calculating and plotting the inverse of √Va versus D, we find the slope of the best-fit line. The distance between atoms, d, in the graphite sample was determined by evaluating equation (10). In order to increase the validity of the experiment and decrease the effect of the error in the measurement of D, we calculated the D from the measurement of the secant line from the unobstructed ray to the diffraction maximum. For further explanation and derivation of the supplementary method, see Appendix B.
Results
Using the linear regression function in Microsoft Excel, we were able to determine the error in the slope of the graph of 1⁄√Va versus D. We added the fractional uncertainty of this slope in quadrature with the fractional uncertainty in the values of h, m, e, and L. The determined values for the distance between carbon atoms using the value for D measured directly was 1.28 +/- 0.04 Å for douter and 2.23 +/- 0.09 Å for dinner. Using the same error analysis, the method using the secant line to calculate D determined the distance between carbon atoms was 1.23 +/- 0.09 Å for douter and 2.0 +/- 0.1 Å for dinner.
The values for douter and dinner as reported by the TEL 555 Manual are 1.23 +/- 0.01 Å and 2.13 +/- 0.01 Å, respectively. Both methods for measuring the two distances between carbon atoms in graphite yielded results close to agreeing with the reported values found in the TEL 555 Manual, which leads us to believe our experiment was well executed.
However, because we have two separate methods for determining the same values we used a weighted average to determine a best estimate for the values of d. The values determined for the distance between the carbon atoms in graphite were douter = 1.27 +/- 0.04 Å and dinner = 2.13 +/- 0.07 Å. The absolute error in these values comfortably overlaps with the values for douter and dinner stated in the TEL 555 Manual. A detailed explanation of the uncertainty can be found in Appendix C, along with the data from the experiment.
The most significant source of error in this experiment is the measurement of the value of . The width of the lines used to define the diameter is approximately a millimeter thick. Determining the diameter is based on the judgment of the experimenter, which adds more error to a poor measurement. To increase the precision of this experiment, a superior method for obtaining D would need to be developed.
Acknowledgements
The author would like to thank, Eric Brown, Nicolas LeGall, Eric Lechner, and Dr. Sawyer for their assistance with the apparatus and experimental procedure.
Appendix A, B, and C
Widget is loading comments...

